ForeUI is an easy-to-use UI prototyping tool, designed to create mockup / wireframe / prototypes for any application or website you have in mind.

Archive for September, 2010

ForeUI V2.47: Many New Features and Enhancements

Hello everyone, ForeUI V2.47 is out today and you can download now.  There are many new features and enhancements included in this version.  Please read on.

Exchange Data with Outside World

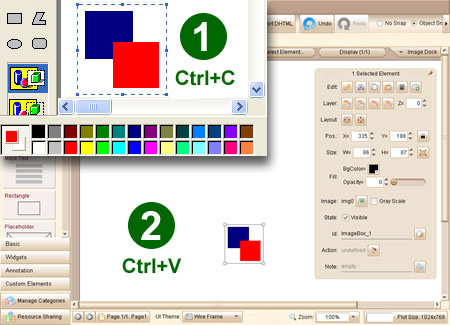
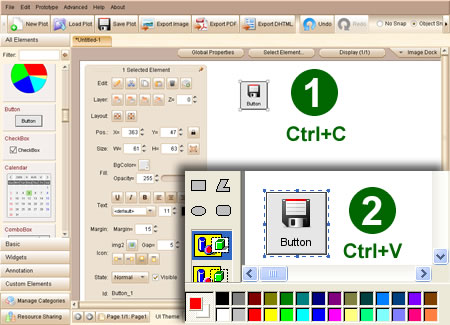
Now ForeUI can exchange data with external applications via clipboard.  You can copy image from any application and paste it into ForeUI as an ImageBox element; you can also copy the selected elements in ForeUI and paste them as an image into other drawing applications.

What’s more, you can directly drag image or plot file into ForeUI now.  The image file will be converted to an ImageBox element if you drag it to the editing area.  If you drag an image file into the image dock, it will be stored there.  Dragging a plot file to editing area or the tabs for plot will load the plot in ForeUI immediately.

More Powerful Actions

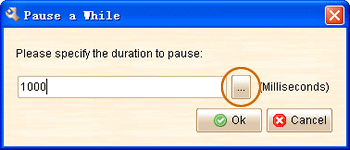
Now you can use properties in the “Pause a While” action, that means the delay time can be changed during the simulation.

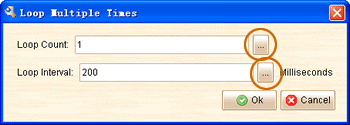
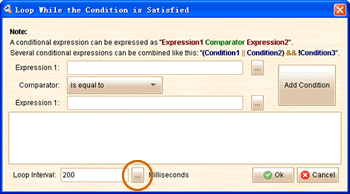
What’s more, you can use properties in the loop:

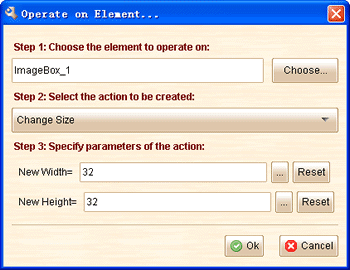
Another enhancement is that you can change the size of ImageBox during the simulation:

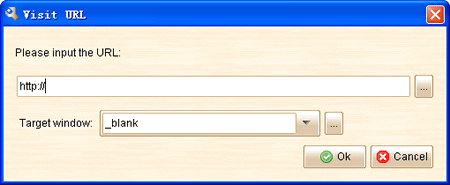
And you can specify the target window for “Visit URL” action now:

Specify the Plot’s Default Font

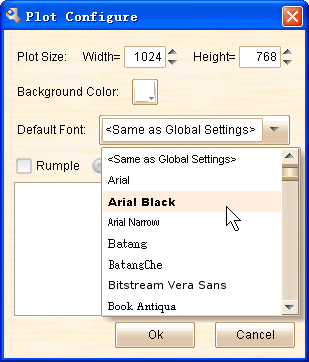
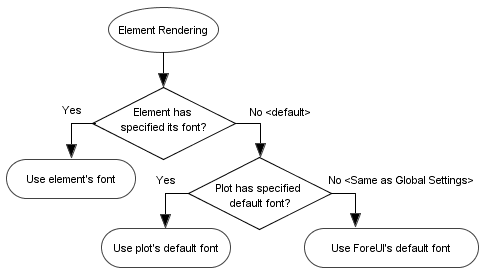
From now on, you can specify the default font for every plot in the plot configure window:

The actual font for element rendering will be determined by the process below:

Reduce Redundant Files in DHTML

In previous versions, all ImageBox elements will be exported as a PNG files, even if they all link to the same image in image dock.  Now we reduce the redundant files, if multiple ImageBox elements link to the same image, only one PNG file will be exported for their references.

This enhancement will gain a very good result if many ImageBox elements are used in the plot.  Below is a comparison between the DHTML for “Fwitter.4ui” by V2.45 and V2.47:

Move Element Out of Bounds

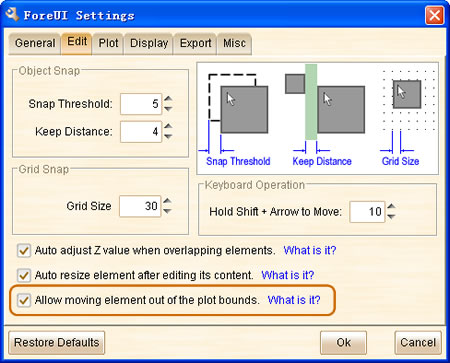
From this version, you can move element out of the plot’s bounds.  You can turn on / off this in the settings window (default is on)

Other Enhancements:

  • Improve image dock rendering performance.
  • Auto add backslash before ” or ‘ when editing message of User Decision branching and Show Message action.
  • Generate log files to user’s directory.

Fixed Bugs:

  • Bug_0240: Line and Arrow Line elements can not be displayed in V2.45.
  • Bug_0241: Right-clicking element which is placed over a container (to bring out context menu), the element should not be embedded.
  • Bug_0242: Text element editor does not select all editable content when show up in V2.45.
  • Bug_0243: Move embeded element to upper/lower layer, may duplicate the element.
  • Bug_0244: If custom element contains embedded element, creating multiple instances of the custom element may cause duplicated ids.
  • Bug_0245: Sometimes the element id in action expression is not replaced correctly when doing copy/paste or creating custom element instance.

ForeUI V2.45: Optimize DHTML Generating and More

2

Hello everyone, ForeUI V2.45 is out today as scheduled.  This version is focusing quality and performance.  Enhancements cover DHTML generating optimization, new id allocate algorithm, popup tool windows management and much more.

DHTML Generating Optimization

This is an exciting enhancement as it decrease the file number and total file size, thus reduce the time for simulation loading.  How did we do achieve this?  It’s simple and straightforward: we merged the script files and images files for each elements, thus the file number can be decreased and the space for image file headers can be saved.  The effect of this kind of optimization will be quite significant when plot become big and complex.

Here are some testing results against V2.45 and V2.42, which use the “Fwitter.4ui” plot as testing sample.  We exported the plot to DHTML simulation using V2.42 and V2.45 respectively.  The file number and total file size are measured.  We open the native simulation in different web browsers to measure the local loading time, and then upload the DHTML simulations to web server and open the remote simulation in different web browsers to measure the remote loading time.

V2.42 V2.45
Number of DHTML files
676
308
Total size of DHTML files (bytes)
1293111
1095213
V2.42 V2.45
Time to load simulation locally (seconds)
IE 6.0
16
3
Firefox 3.6
~2
<1
Chrome 6.0
~2
<1
Safari 5.0
~2
<1
Opera 6.2
~2
<1
V2.42 V2.45
Time to load simulation from web server (seconds)
IE 6.0
252
43
Firefox 3.6
61
33
Chrome 6.0
59
30
Safari 5.0
60
32
Opera 6.2
180
31

It is not a strict testing, however the result can still give us a rough idea of the effect.  The good news is that the effect will be enlarged as the plot become bigger and more complex.  You may notice that the loading time on IE (and Opera for remote loading) is much longer than that on other browsers.  After optimize the loading performance on IE is improved a lot and the difference is much smaller now.

New Algorithm for Id Allocation

In this version we introduce a new new algorithm for id allocation, I bet you will like it 🙂

Before V2.45, if you copy an element with id “Button_1”, and paste into the same plot, the newly pasted element will have an id like “Button_1_1”.  If you repeat the steps several times, you may get an element with a very long id like “Button_1_1_1_1_1_1_1_1_1_1”.  That’s very bad thing as you can not count out how many “1” in the id by first glance, the ids are long and not readable.

Now in V2.45, if you copy and paste an element with id “Button_1”, the newly pasted element will have an id like “Button_2”.  After several repeats, you will get an element with id like “Button_18”, this is much better, isn’t it?

What’s more, the new algorithm will try to keep the additional info in ids.  e.g. if you copy and paste an element with id “CheckBox_Option_1”, you can get the new element with id “CheckBox_Option_2”.  That can help you to understand the new element is similar with the source element.

We are quite excited about the new algorithm as it can significantly reduce the average length of element ids, and make ids more readable.  We should really make it earlier 😛

Tool Windows Management

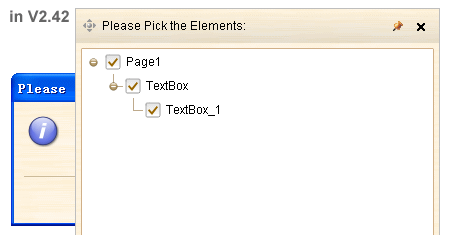
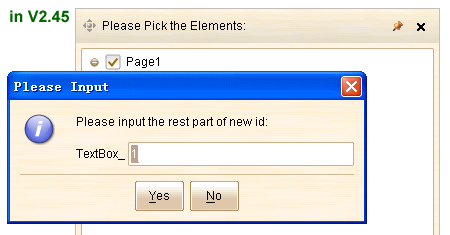
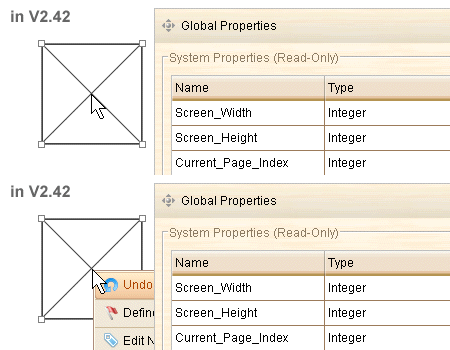
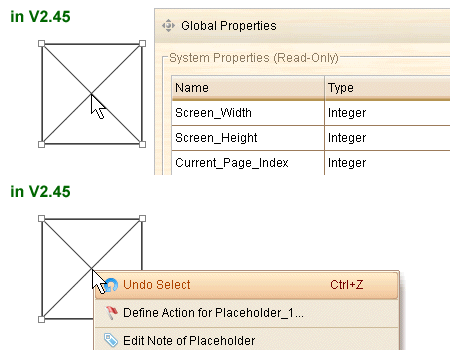
There are some tool windows in ForeUI, such as element selector, page manage window, category manage window etc.  Usually these window will be closed when focus is lost, however you can pin the window to keep it in the screen.  Before V2.45, if a tool window is pinned on screen, it will be placed at top and all popup stuffs like message box, popup menu, element editor etc. will be covered by the tool window.  Now we have enhanced this situation, see comparison below:

Another enhancement is that when minimizing the window of ForeUI, all opened tool windows will be hidden as well, thus you can work on other applications without interference.  When you restore ForeUI window, these tool windows will be restored too.

Avoid Negative Z Value

It is recommended not to use negative Z value, because in web browsers other than IE, the element with negative Z value can not receive any mouse event.  So we make some enhancements to avoid the negative Z value being used.

Now the and buttons on floating tool pane can only reduce the Z value down to zero.  If you are sure you need a negative Z value, you can input it directly, like this

Also the Auto Adjust Z Value feature will not set a negative Z value anymore.

Other Enhancements:

  • Validate path before saving the plot file.
  • Highlight the editable part of id when element id editor window shown up.
  • Allow setting z value for embedded element.

Fixed Bugs:

  • Bug_0236: Double clicking embedded element can not open its editor.
  • Bug_0237: Disabled Spinner element should not be able to spin.
  • Bug_0238: Can not disable Tabs/Vertical Tabs element in simulation.
  • Bug_0239: Button text is not correctly align with icon when icon is on top/bottom of text, and text width is less than icon, and using center alignment.

Use Looksie to Make Reports for ForeUI Plot

2

Looksie is a desktop tool that focuses on improving the entire prototyping process from design through to test. XemWare Limited, the developer of Looksie contacted us about eight months ago and we were all excited about the future of prototyping technology, then we setup a firm cooperative relationship. Looksie V1.00 is launched on September 1st and I am happy to introduce this promising product to you. Below is the main GUI of Looksie:
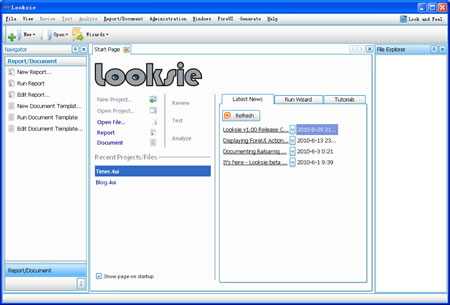
GUI of Looksie

Looksie is integrated with ForeUI and help you to do some interesting things on your prototype, including:

  • Generate configurable report for given prototype
  • Generate configurable Word/Excel document for prototype
  • Find/Replace text strings in ForeUI plot
  • Generate ForeUI plot from database

There are more exciting features under development, such as generating plot for existing web site and testing system for prototype etc. In this article I will mainly focus on the report generation and report design features of Looksie.

Report Generation

This feature will be quite useful if you have a complex prototype and need to review its details. Looksie already provides some finished report templates; you can use them to generate the report for your ForeUI plots on hand. To generate the report, just click the “Run Report” item in the “Report/Document” list in the Navigator, then a new “Reports” page will be opened and you can see two lists on it. The upper list is for the loaded plot files, you can open as many plots as you need and generate the report for all of them. The lower list is the report templates discovered by Looksie, you can choose a template and click the “Run Report” button below to generate and view the report.
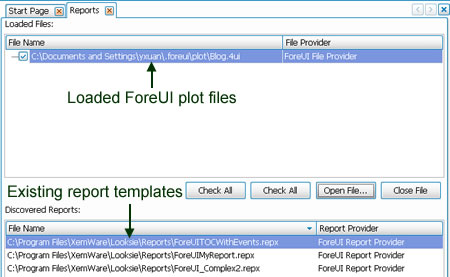
Discovered Templates

The report preview window will shows up once you click the “Run Report” button. In this window you can review the content report page by page (just like browsing a World document). You can save the report to .prnx file so that you can open and review it with Looksie. You can also print the report to papers or export the report to many formats, such as PDF, HTML, RTF, XLS etc.
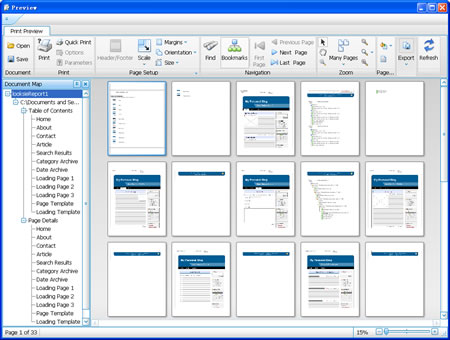
Looksie Report Preview

Here is a step-by-step tutorial of report generation on Looksie official web site, which is really helpful.

Report Design

The most exciting thing is that you can create your own report template! You can design how your report will look like, from content to layout, to coloring etc. To define a new report template, just click the “New Report…” item in the main GUI, then choose the “ForeUI Report Provider” to continue, the report designer will be opened.
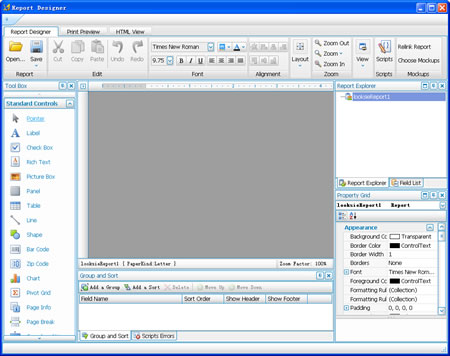
Report Designer in Looksie

The report designer is very powerful. It allows you to create the report structure from scratch. However you need to know more about the report structure and ForeUI plot data structure to use the report designer.

In the report designer, a report consists of multiple bands, and all bands have the same width (equals to the page width). For example, a report can have a header band, a detail band and a footer band, and each band can have multiple child bands below it. Here is a figure that showcases how a report is generated with given report template and plot. As you can see the report detail band will be repeated automatically if it is bound to a collection of details. Since the report detail band can be nested, it can represent really complex data structure. You can always browse the band hierarchy in the Report Explorer on the right in GUI.
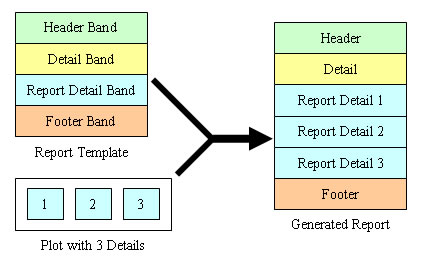
Report Structure

The gray region in the center is the report editing area. We can right click this area and trigger the context menu, then select the band to insert. When inserting report detail band, you can also specify the detail collection to bind, the collections has a name that starts with “#”.
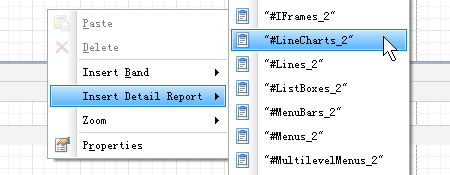
Insert Band into Report

Tweaking the band is very easy, you can drag the bottom of a band to adjust its height, and you can also change its properties in the Property Grid on the bottom right corner.
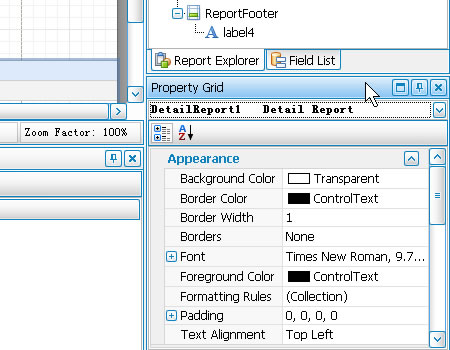
Property Grid in Looksie

Before using the report designer to create your own report template, you should also know some details about the data within a ForeUI plot. A plot contains some simple attributes like width, height, background color etc; also it contains some collections for complex data. Such as the collection of all pages in the plot, the collection of all elements, the collection of all events etc. The figure below shows the basic hierarchy structure of plot data:
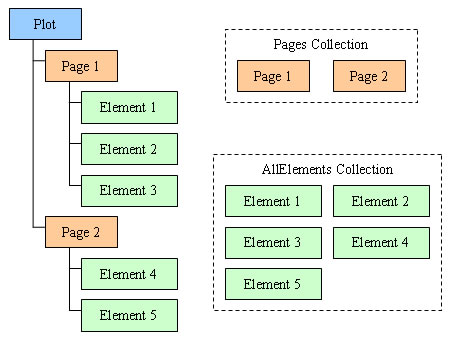
ForeUI Plot Data Structure

In the report designer, the data of plot is mapped into fields, which can be reviewed in the Field List on the right. In the list, a collection will have a name starts with “#”. For instance, the #AllElements is the collection for all elements in the plot. As you can see, there are many collections fields available in the list, so that you can bind them with detail report bands as you need. You can even drag the field into the report area directly, the report design will smartly create suitable component and bind with the field.
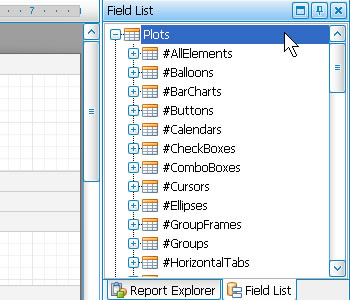
Field List in Looksie

Creating new design template is kind of complex but also interesting. Here is a detailed tutorial on Looksie web site, which helps you to create a new report template step by step. After finishing a template with the guidance from tutorial, I think I could really create something I need. In the ForeUI support forum, the ability to print out all behavior definitions is required here and here.  It is a shame that after so long time we haven’t provide this feature yet. However it seems that we could do this with Looksie now. I worked on it for one hour or two and created a report template for behavior printing. Below is the preview of the action report for “Timer.4ui” example plot.
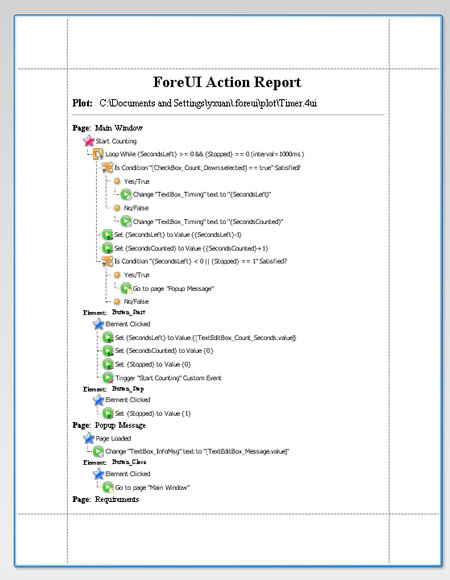
ForeUI Action Report

Summary

The report generation and report design feature is quite useful for ForeUI plot reviewing. Although the report designer is kind of complex for the beginners, it could be improved by providing more detailed documents and tutorials in the future. As a newly launched product, Looksie is good enough and worth trying out.