ForeUI is an easy-to-use UI prototyping tool, designed to create mockup / wireframe / prototypes for any application or website you have in mind.

All posts by ForeUI

ForeUI is in the “Best Tools for Making Wireframes” List from DesignContest

DesignContest recently published their “Best Tools for Making Wireframes” list in their blog, and we are proud to find out that ForeUI is in the list 😀

ForeUI_DC

Although we think ForeUI is much, much more than a wireframing tool, we are still happy to see ForeUI get listed in this list.

About DesignContest

Design Contest is a community shaped by the joint efforts of talented designers and contest holders, helping decent clients and good designers to find each other. The info-graphic below is compiled by DesignContest to represent the scope of the graphic design industry. The landscape is divided into 5 branches, and includes some of the most outstanding options to choose. The objective of this info-graphic is to help you find the right company or method to create your designs, as well as to see the competition.

graphic_design_industry_landscape

ForeUI V3.90: Mark Element “Clickable” and Change Tooltip Dynamically

ForeUI V3.90 is released today! Besides the potential minor update (SP) versions on it, this version will be the last one before V4.0 (V4.0 will be released on early 2015).

Easily Mark Element “Clickable”

If you have ever used ForeUI to create a custom button, there is a big chance that you have ever handled “Mouse Over” and “Mouse Out” events and set the system cursor accordingly. If you are making a website prototype, you may want to make a lot of “clickable” areas on the page, handling those two mouse events on so many elements are really time consuming, and it makes the behavior list looks more complex.

Since V3.90, a new, simple option appears in the tools panel and allows you to mark element “clickable”. This option is available for almost all elements, except Button, Radio Button, CheckBox, Hyperlink and ComboBox, which are always clickable in simulation. Once an element is marked as “clickable”, it will change the shape of cursor that is hovering on it in the HTML5 simulation, thus acts like a clickable object on the page.

MarkClickable

Change Tooltip Dynamically

Tooltip is often used to prompt user about the functionality of button or other objects on the UI. If you just need a static tooltip, it could be specified in the “Tooltip” field in tools panel. But sometimes you may want to have a dynamic tooltip, which will change according to the context. This becomes possible since V3.90. A new “Set Tooltip” action is available in “Manipulate Elements…” window for all elements.

SetTooltip

The tooltip here can contain properties as well, so it is really a dynamic one. Setting an empty tooltip will remove tooltip from the element.

“Page Unloaded” Event

Almost everyone has used the “Page Loaded” event, which will be triggered when the target page is about to show. That is very useful when you want to initialize something before the page is shown. Now we have the “Page Unloaded” event, which will be triggered when you are about to leave the page. The handler for “Page Unloaded” event is the perfect place to clean up something before leaving.

PageUnloadedEvent

Collapse Behavior Tree Item

Now you can collapse behavior tree item. If you have a big branch in the behavior tree and you are not checking on it, collapsing it can save a lot of room and you can focus on the part you are reviewing.

collapsableTreeItem

Other Changes

You can find the complete list of changes made in this update here.


ForeUI V3.8: Use ClipArt to Make HTML5 Simulation Smaller and Faster

ForeUI V3.80 is released today.  This version introduces a new approach to optimize your HTML5 simulation, which is extremely useful for people who want to create big, complex prototype with ForeUI.

After actively working on a plot for some time, you may find out that your plot becomes bigger and bigger. Loading and saving the plot file is slow, and it may take several minutes to launch the simulation in web browser. When this happens, we would suggest you to optimize your plot before adding more content into it. Actually, the best practice is to understand how to avoid unnecessarily increase your plot size, and keep your plot small and neat at the beginning. We have a document to introduce all currently known tricks for this topic.

Before version 3.8, those tricks focus on avoiding duplicated or useless content in your plot. Since this new version, we have a new approach, which is to reduce the number of DOM objects that need to be loaded by the web browser, hence directly make your HTML5 simulation smaller and faster. Consider such an example: on the page you have a chart created with basic shape elements, such as rectangle, arrow line, text box etc., and you have two buttons to navigate between pages. Actually only these two buttons have their behavior defined, and other elements are just shapes or text, which are completely static. If you use older version of ForeUI to generate HTML5 simulation for it, all those elements will be converted to DOM objects, which have to be loaded by the web browser. If your plot has a lot of shape elements which are actually static during the simulation, loading them as DOM objects is a waste of resource for web browser, and you will see the simulation loading time meaninglessly prolonged.ChartNav
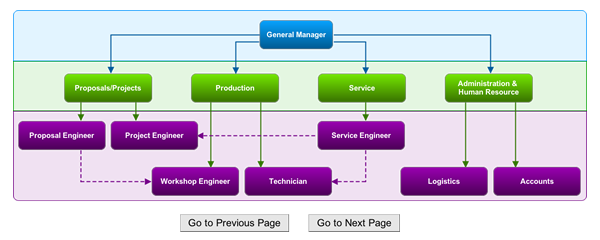
I guess you already know what I am going to say, the best way to treat those “static” element is to put them into an image and let them display as a static background, while those buttons that have behavior defined should be kept as they are. So to simulate the page mentioned above, the web browser just need to load 3 DOM objects: the static chart image and two buttons, which will be very fast! Now the question is: how to tell ForeUI to do so?

ClipArt Element

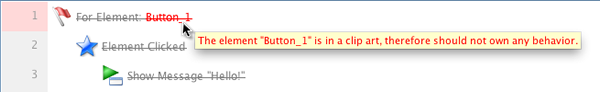
The answer is to use ClipArt element, which is newly included in ForeUI V3.80. This new ClipArt element is not an element that you can directly drag and add into your plot. You will need to select one or more elements and then click the convert_clipart button in the tools panel to wrap it/them as a ClipArt. ClipArt is just like a Group, but it will be output as a static picture in the HTML5 simulation, which means all its members will not be interactive during the simulation. So please make sure not to abuse it, and do not put any element that has (or will have) behavior defined into the ClipArt, otherwise ForeUI will warn you in the behavior editor:

ClipArtError

Wrapping some elements into a ClipArt looks like to put a static picture into your page, but there is difference: you can not modify the content of static picture in ForeUI, but you can edit the members of ClipArt as you wish. What’s more, you can always restore those elements from the ClipArt. This is extremely useful when you need to modify the diagram frequently.

You maybe interested in how good this kind of optimization can be, let’s see some comparisons.

The two plots in the comparison have the same content and behavior, the only difference is the second one converts all static elements into ClipArt elements. The plot files and HTML5 simulations are available in the table, so you can do the test by yourself. Your result may vary a little bit, depends on the hardware and software environment, but you will see the similar result, that the plot use ClipArt can be loaded much faster.

If you have a big plot, try using the methods mentioned in this document to optimize its size. If you are just starting a new plot, please also learn those tricks and keep your plot small. If you just want to create a prototype with less than 20 pages, it should be fine to ignore all these optimizations. However, if you are targeting a prototype with 100+ pages and still want it to be small and fast (it is possible, we have saw people did it), those optimizations are almost mandatory.

Enjoy the New Website!

Dear friends, we are happy to announce that today our new website is online!

The new website is created with WordPress, which makes the management of website content much easier, and provides better experience. What’s more, we also upgraded the server hardware (increase memory and use SSD), and now it is really faster! We hope you will enjoy it.

new_website

Meanwhile we also created a new video to introduce ForeUI, and we hope this video can help new visitors to have a quick idea of what ForeUI could do and how good result it could achieve. The video is now embedded in the home page:


We will add some new tutorials and examples to the web site very soon, so please stay tuned 🙂

Happy Easter! V3.70 is Released Today

Happy Easter! We hope you enjoy your Easter holiday. Today we are pleased to announce the release of ForeUI V3.70.

New Action to Call Javascript Code

You may want to integrate your ForeUI simulation with existing application, which may need to call Javascript function in your simulation. Although there are some workarounds to achieve this in previous versions, they are kind of hacking and doesn’t look good. Now we have a new action named “Call Javascript Snippet”, which allows you to write any Javascript code you want to be called, thus you can call any existing Javascript function in it.

Screen Shot 2014-04-21 at 11.32.49 AM

Remarks: just like the “Javascript Code” element, this new action is prepared for advanced users. You should know what you are doing when using it, calling incorrect Javascript may bring strange behavior to your HTML5 simulation, and sometimes even halts the entire simulation.

New Actions to Change Background for Basic Shapes

Now we have a new action for those “basic shape” elements to change their background color and opacity on the fly. Previously only the TextBox element supports the “Change Backround Color” and “Change Opacity” actions, now the Rectangle, Ellipse, Triangle and Polygon elements all support these two actions.

ChangeOpacityNo Need to Escape the Quotation Marks in Expression

There was an annoying issue when you use quotation marks in the expression: you simulation may not work if you didn’t escape the quotation marks (you can read this, this and this for more details). Now the problem has been solved and you don’t need to put something like “”good”” in your expression any more. If you have escaped quotation marks in your existing plot files, no worry and they will still work as they did.no_escape_quote

Other Changes

There are other enhancements and bug fixings in this version. Please read the list of all changes here.