ForeUI is an easy-to-use UI prototyping tool, designed to create mockup / wireframe / prototypes for any application or website you have in mind.

All posts in Feature

Simulate Multi-Threading in ForeUI

1

ForeUI offers a powerful behavior engine, which allows you to define complex interaction in an elegant way for any GUI element on the screen.  Sometimes you may want to run multiple tasks parallelly, which is also called “multi-threading” in the software industry.  For example, assume we have a button, and we want to move it on right-down direction and enlarge it at the same time.  Is it possible to do so in ForeUI?  The answer is positive, that’s why I write this post 🙂

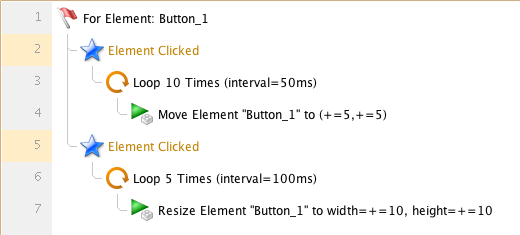
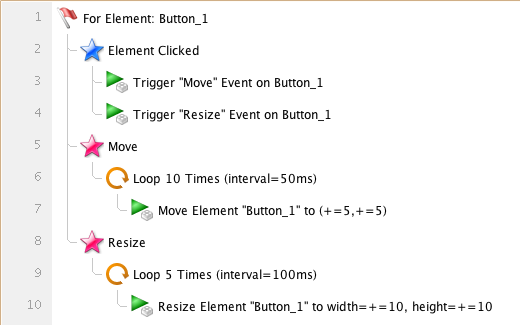
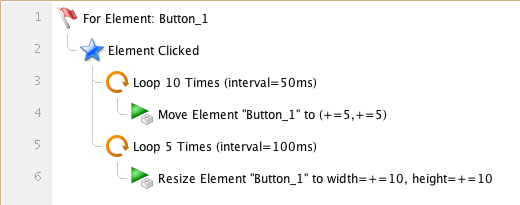
First let’s create a single-thread version for the example, so you can later compare it with the multi-threading version.  The example only contains one button element (Button_1) and its behavior is defined as below:

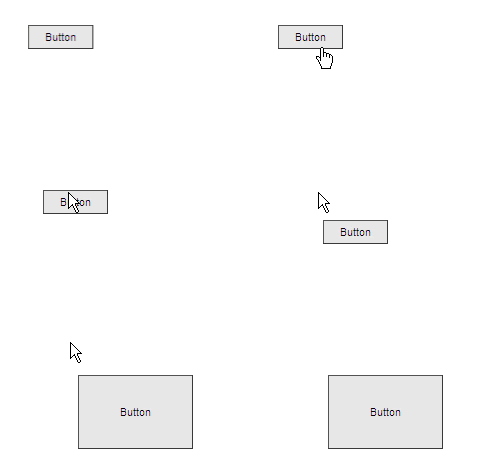
There are two loops in the event handler for “Element Clicked” event: one for moving and one for resizing the button.  I designedly use different looping parameters for them, so we have good reason that not to merge them into one loop.  Since it is a single-thread version, it can only do the moving and resizing in sequence, like this:

You can download the plot file for single thread example, or view its simulation here.

Now lets try to make the multi-threading.  The basic of the trick is that, the event triggering is not a blocking call.  That means, when you trigger two events in order, the second event will not wait for the execution of event handler for the first event.  As a non-blocking call, triggering an event takes almost no time, so the two events seems to be triggered at the same time, and their event handlers seems to be launched together.

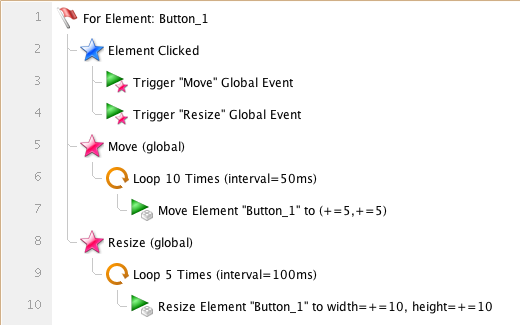
So I changed the behavior for Button_1 as below.  I added two “Element_Clicked” events to Button_1 and they will do moving and resizing accordingly.  There are two warnings (highlighted with yellow) since we place the same event twice in one element.  We know what we are doing, so just ignore these warnings.

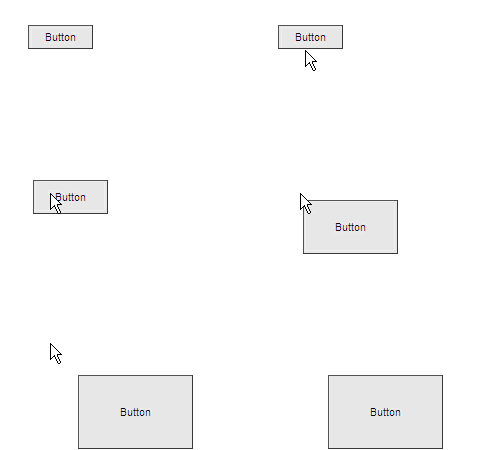
Since the two loops are placed in different event handlers, they will be launched at (almost) the same time, thus you will see they are executed parallelly:

You can download the plot file for multi-threading example, or view its simulation here.

If you’d like to place the behavior definition in custom event handler, you can modify the example like this:  (download this plot file)

If you don’t want to use global custom event, you can define it as the private event for Button_1, like this: (download this plot file)

The three examples above will work in the same way, you can choose the one you like when you want to do multi-threading in ForeUI.

Maybe you already know that ForeUI will convert the behavior to Javascript when exporting plot to HTML5.  If you search “Javascript Multithreading” on the Internet, you will learn that Javascript does not actually support multi-threading (at least for now).  So all multithreading in Javascript are tricks, they are just simulating the concurrent execution.  However, if you have ever tried to manually write some Javascript code to simulate the multi-threading, you will see how difficult it will be and how easy to make mistake somewhere.  You will realize that ForeUI saves you a lot of time on achieving this 😉
ForeUI V3.0 Official Released!

The official release of ForeUI V3.0 is delivered today.  Comparing with the previous releases, this version is more focus on the reliability and usability.  However, there is still an exciting new feature in this version, which is called “integration task” that can easily integrate ForeUI with other tools.

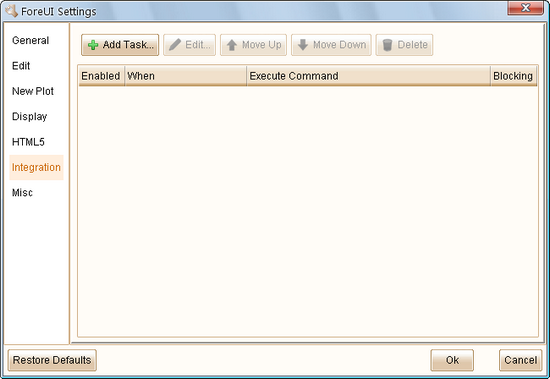
You may already know that you can invoke ForeUI via command line to generate image or HTML5 simulation.  However, have you considered to use other tools to process the file(s) generated by ForeUI?  The integration task is designed for that purpose.  In the settings window, you will see a new tab named “Integration”, which allows you to manage the integration tasks.

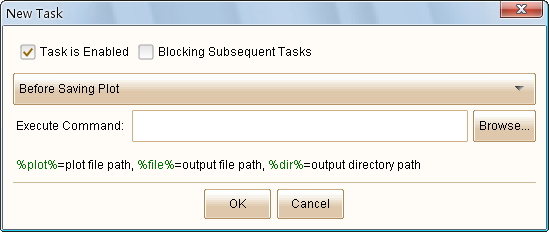
You can click the “Add Task…” button to add a new integration task.  Here you can specify the parameters for the task.

If you unselect the “Task is Enabled” option, the new task will be created but not take effect immediately, until you enable it later.

If you select the “Blocking Subsequent Tasks” option, the new task will block the workflow until the command is finished.  This is useful when you want to execute a serial of tasks in order.

You will need to specify the condition that trigger the task.  So far ForeUI supports these conditions:

  • Before Saving Plot
  • After Saving Plot
  • Before Export HTML5
  • After Export HTML5

You can input or browse the command to be executed, and you can use the variables below in the command:

  • %plot%: the file path of the current editing plot.
  • %file%: the path of the output file.  For Before/After Saving Plot task, it will be the path of plot file to save; For Before/After Export HTML5 task, it will be the path of generated HTML file.
  • %dir%: the path of the output directory.  For Before/After Saving Plot task, it will be the path of directory to save plot file; For Before/After Export HTML5 task, it will be the path of directory that store the generated HTML files.

By making use of the integration task, you can invoke other tools to process the file generated by ForeUI.

Example:  Auto Commit Plot File to SVN Repository

Some customers have asked for the version control feature.  Now we can have it by integrating ForeUI with SVN.  If you are not familiar with the usage of SVN, you can find some tutorials via google.

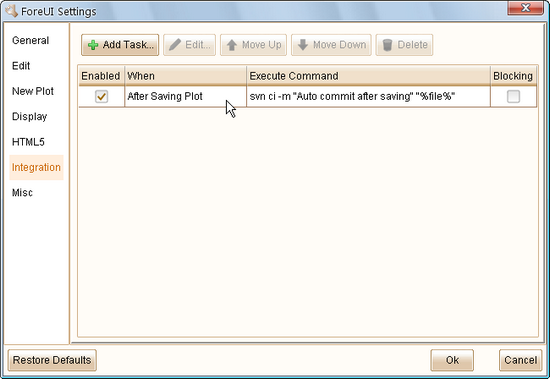
Assume that you want to commit the plot file to SVN repository everytime after you save the plot.  First you should add your plot file into a project, and checkout your project to a local directory.  Then please open the plot with ForeUI and go to the “Integration” tab in settings window.  You can create an integration task like this:

That’s all, every time you save your plot, it will be committed to the SVN repository, so you will never lose your work, theoretically 🙂

If the plot file is not added into your SVN project, the command above will do nothing.

Remarks: the integration task feature is available for registered user only.

Other Enhancements and Bug Fixings:

Please check out this page to see the complete list of enhancements and fixed bugs in this version.

ForeUI V3.0 RC Released!

2

ForeUI 3.0 RC version is just released.  As the last version before V3.0 official release, this version tend to be stable and offer much better experience.  We don’t plan to add new feature in the official release of 3.0, instead we will include the completed document and have some bugs fixed.

We have made so many improvements in this version that I could not introduce them one by one.  A full list of new features, enhancements and bug fixings can be found here.  In this blog post, I would like to show you the most interesting part of this update.

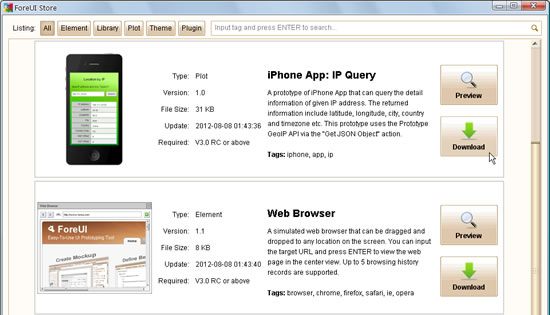
ForeUI Store

From this version, ForeUI integrates with its new online resource store.  You can download new element, library or plot file from store window, or from the store web site.  You will be able to download new UI theme and ForeUI plugins from the same site in the future.

Clicking the category buttons on top can filter the items to be listed.  You can also search the item by tag via the search box on top right corner.  If you click the “Preview” button, the HTML 5 simulation of the item will be launched in your web browser, and you can see how it works.  Clicking on the “Download” button will download the item and deploy it (if needed).

The store is just online and there is not so much resource inside yet.  We will frequently add new resources into the store site.

Drag and Drop in Outline View

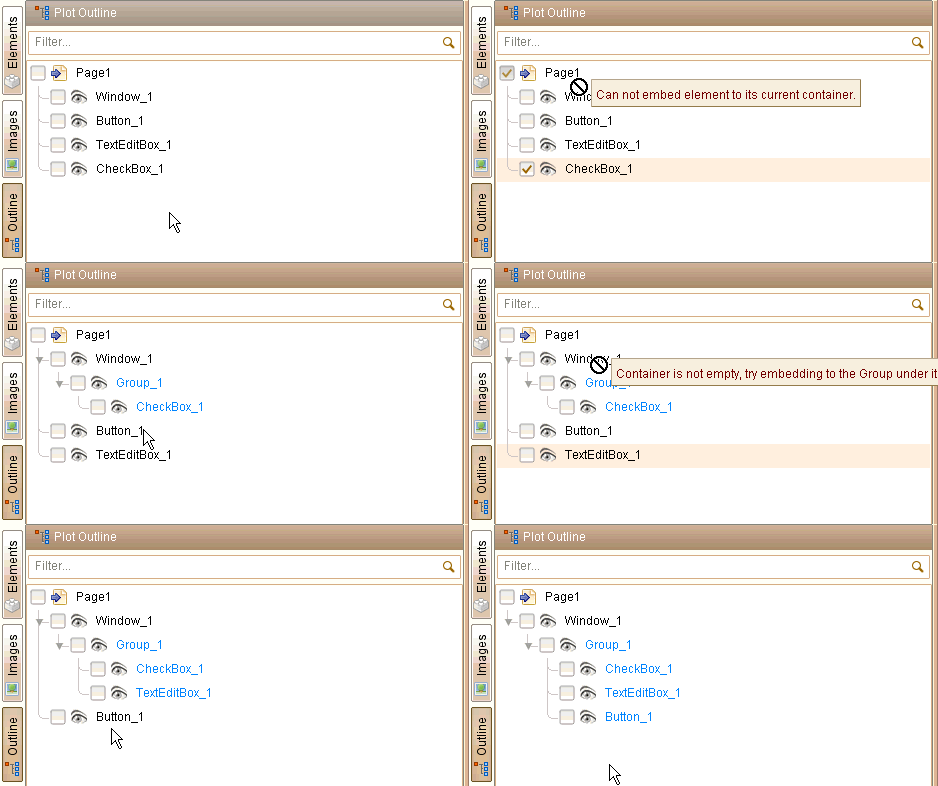
The outline view is significantly improved by supporting drag and drop elements directly.  This is an easy way to embed element into container, or move embedded element from one container to another.

When you drag an element and try to drop it into a container, the tool-tip will tell you if it is allowed.  So you will know what you can do and what you can’t, also you will know why.  This feature is extremely useful when you want to manage a lot of overlapped elements.

Other New Stuffs

There are many other new things in this version.  Don’t be surprised if you find something different than they used to be.  Ususally they are changed in a better way, but if you think they are not, please feel free to tell us.

If you are interested in what we exactly did in this version, please check out the update history page.

Add Live Video into ForeUI Plot

Did you know that?  ForeUI already supported adding live video (YouTube, Vimeo etc.) into plot from long time ago.  Perhaps more accurately still, it is supported from the ForeUI version released on Sep 28th, 2009: V1.60!  Thanks for the iFrame element available from that version, we can embed a web page into our plot.  Embedding live video is another use case for this element.

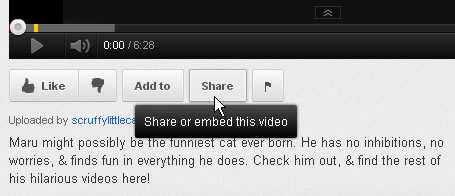
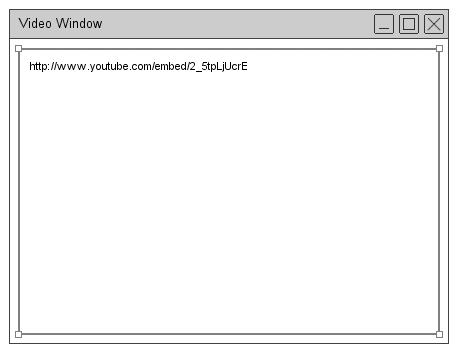
What you need to do is to add an iFrame element into your page, adjust its size and location, then specify the correct URL for live video.  How to find out the video URL?  It depends on the video provider.  If you want to add a video from Youtube, you can find the URL by clicking the “Share” button below the video player:

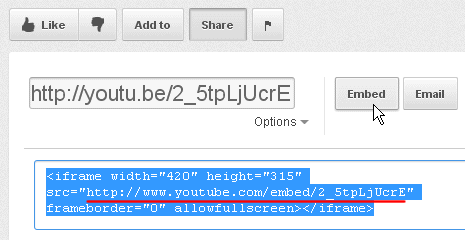
A panel will show up after you click the “Share” button, clicking the “Embed” button on it will show the code to embed video, the exact URL for live video is marked with red underline:

Please copy this URL to clipboard and paste it as the source URL of iFrame element.  A ready-to-go demo is finished now:

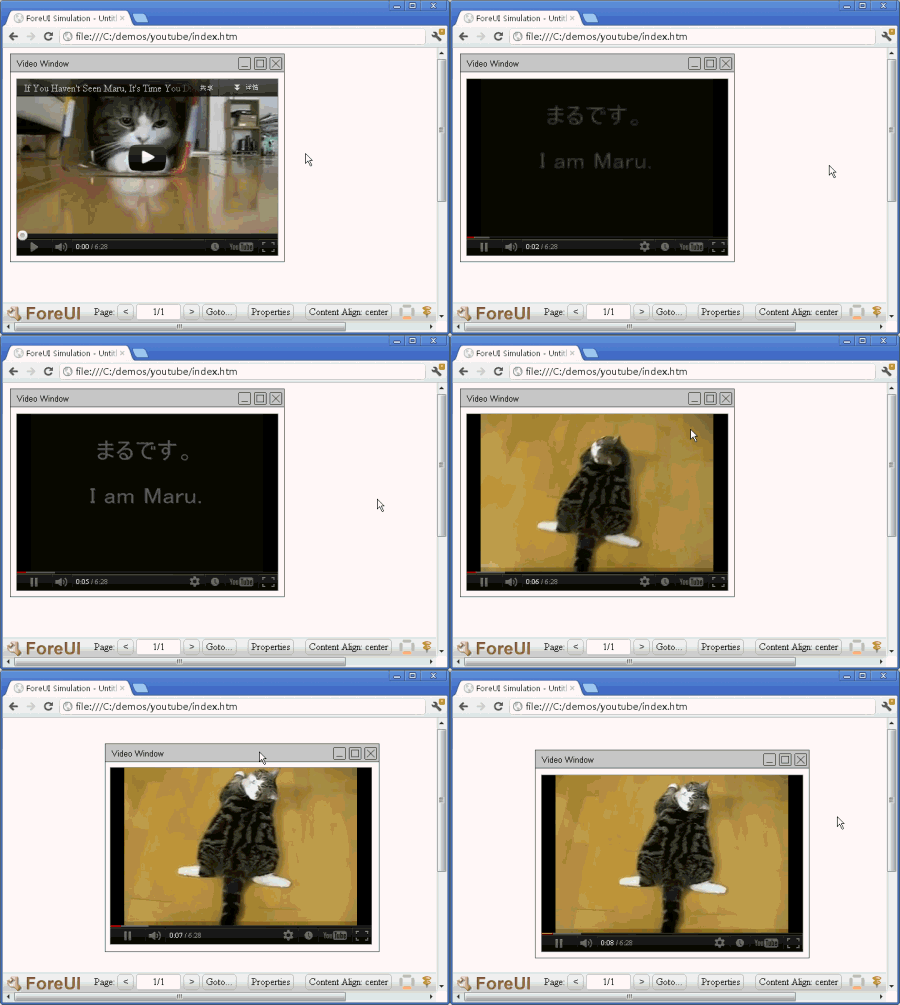
Now run the simulation in web browser and you will see how it works:

If you want to embed video from Vimeo, the steps are quite similar, and you just need to find out the correct URL.  You can click the “Share” button on top right corner of Vimeo video:

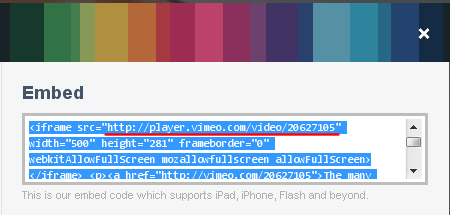
Then you will see a popup panel that includes the embed code on top right, the video URL is marked with red underline:

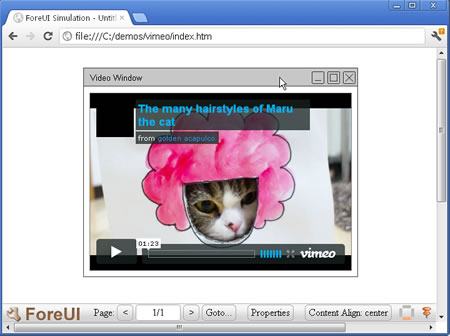
You can use this URL as the source URL of iFrame, and then you can see the result in simulation:

If you want to add live video from other providers, please check if they support embedding video as iframe.  If they do, you can use the same way to embed their videos into your ForeUI plot.


Use JSONP API in ForeUI Plot

1

Web API, JSON and JSONP

Nowadays many web service providers offer some APIs to access their data, which significantly simplify the development of client application for these web services.  Usually the data format of the API will be XML, JSON or JSONP, which means you can request a URL on the Internet and then get a piece of XML or JSON data in the response, which contains the data you are interested in.

The difference between JSONP and JSON is that, JSONP will wrap the JSON data as a function call, while the function name is passed in from the request URL.  Calling JSONP API is usually used to workaround the “The Same Origin Policy” and get JSON data from different servers.  You can find a lot of information about these via Google.

“Get JSON Object” Action

From version 3.0, ForeUI supports a new action named “Get JSON Object”.  This new action allows the HTML simulation to get JSON object from remote server via JSONP API, and store the JSON data to an Object type property (data types are introduced in previous post).  That means ForeUI simulation can actually integrate with other web service via JSONP APIs, and we can even create some web apps with ForeUI!

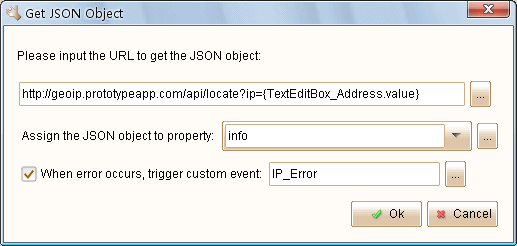
When you add this action, you will be asked to provide some parameters, as shown below:
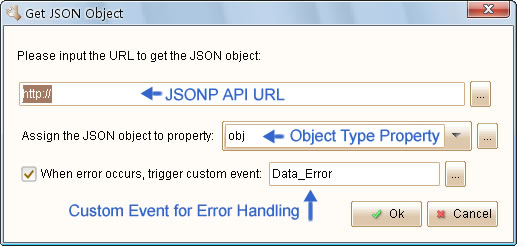
You will need to input the JSONP API here, and specify the name of property that will store the returned JSON data (as an object).  There is an optional parameter that allows you to specify the custom event to trigger, when there is any error happened.

Now I will provide a simple example to show how to use this action.

 Example: Location by IP

This is a simple, and working web app that allows you to get location information by giving the IP address.  This example demostrates the usage of the new “Get JSON Object” action and the object type property.  You will see how powerful ForeUI is 🙂

Since I could not directly query databse in ForeUI, I need to find the JSONP API to the job.  Google always help but my favorite site for searching API is this one.  There are hundreds JSONP APIs listed on the site.  Please keep in mind that JSON API is different than JSONP API, if an API supports JSON format and does not support JSONP format, we just simply not able to use it in ForeUI.

After a few minutes work, I found my desired API: Prototype GeoIP API

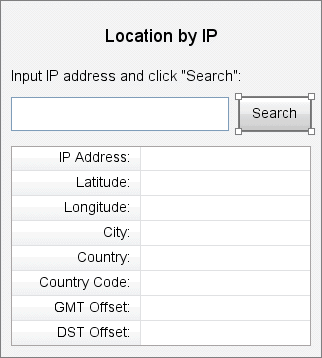
I created the UI of web app very quickly with ForeUI.  I set the plot size to 320×356, which can be perfectly viewed on smart mobile phone.

Than I handle the “Element Clicked” event for the “Search” button, and invoke “Get JSON Object” action with the parameters below:

In the URL field, I inserted the value of input text box as the IP address.  The returned JSON data will be stored in property named “info”.  If any error happened, the custom event “IP_Error” will be triggered.  Remarks: do not use any spaces in the custom event’s name, please use underline instead.

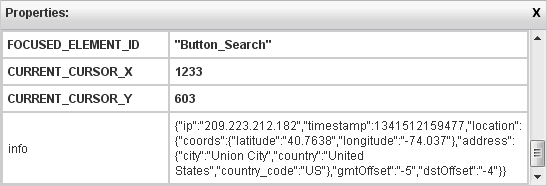
The web app can almost work, if you input an IP address and click “Search” button in simulation, you can see the “info” property is filled with data (from properties view on toolbar).

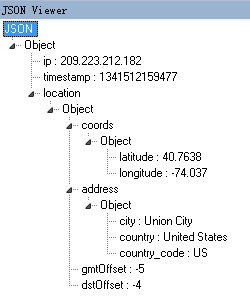
The data stored in “info” property is a JSON object, using a JSON viewer can show its content with better format:

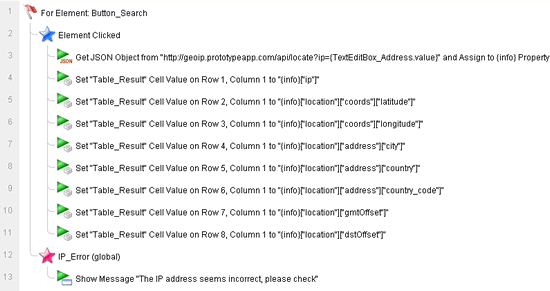
After figuring out how the data is organized, I defined some actions to update the result table, and show a message when error occurs:

That’s all, I exported the plot to HTML and uploaded to our website, you can try it below (an embedded iframe in this post), or you can try it in a separated window.